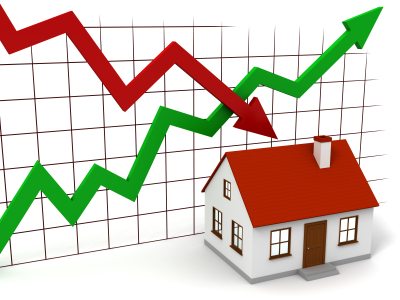
“How’s the Real Estate Market” is a question that we hear often. It is always smart to be an informed if you are looking to buy or sell in the near future. Informed buyers are more likely to know how much their property may be worth. These graphs show statistics of the real estate market in certain Amarillo neighborhoods during the months of July, August, and September for 2017. As many would expect, the number of days on market began to decrease around August as school was approaching. The number of listings remained pretty steady throughout Q3, while the number of new listings in the Wolflin neighborhood increased by 14 from July to August. These graphs will help you see how the neighborhoods that you might be interested are doing.
 |
 |
 |
 |
 |
 |